Pathway classification
An enrichment run returns far more pathways than you asked about. A mouse job matches human disease maps; a plant job matches mammalian signalling. The classification browser is how you put those aside: it shows how the pathways this job found are distributed across the source database's own hierarchy, and lets you hide whole branches of it before you read anything else.
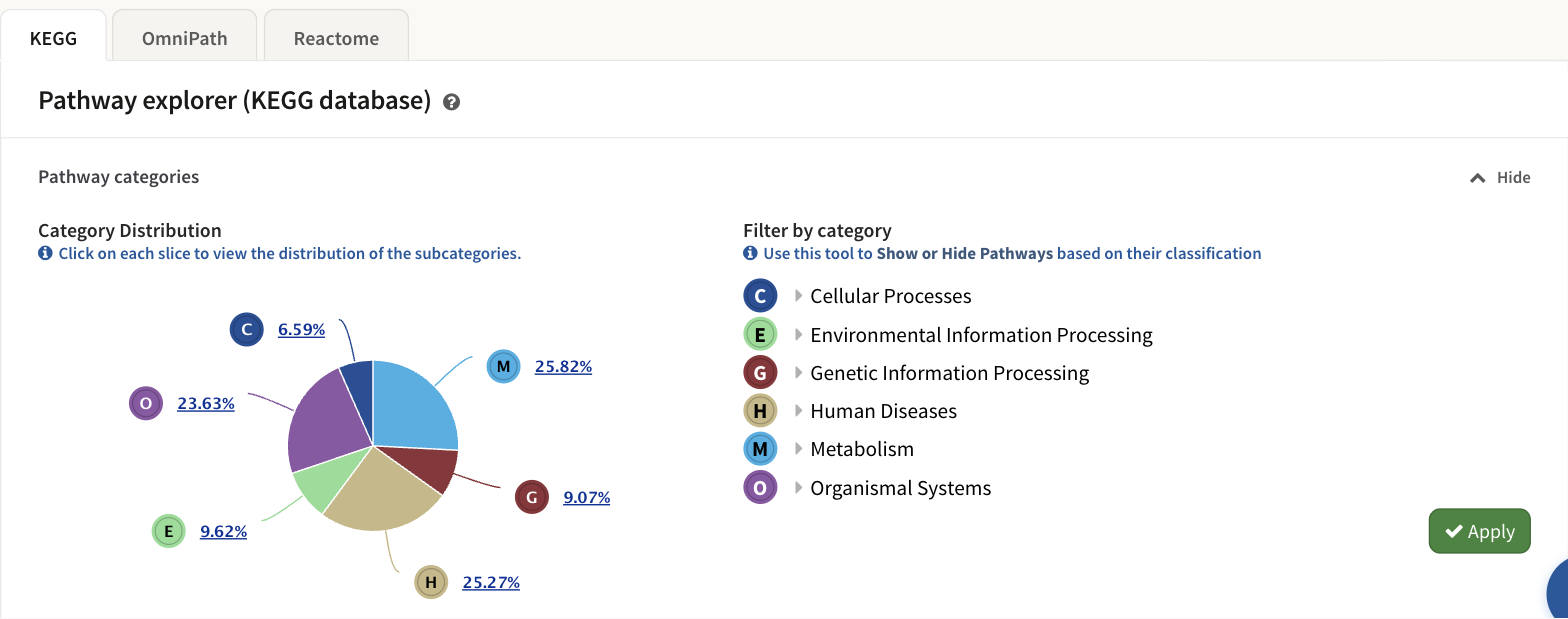
The KEGG tab of the pathway explorer. The pie is the distribution; the tree beside it is the filter; nothing changes until Apply. Illustrated with the STATegra 5-omic example.
One explorer per database
The classification browser is not KEGG-only. It is built once per pathway database the job used, and each copy is a tab: KEGG, Reactome, MapMan, OmniPath. Each tab has its own pie, its own filter tree and its own network, over that database's pathways alone. A job that used a single database has no tab bar.
The card is headed Pathway explorer (database database) and holds two things: the Pathway categories band described here, and the pathway network below it. The band folds away with the Hide control on its right, which gives the network the whole card; the control names what clicking it does — it reads Hide while the band is open and Show once it is folded.
Which hierarchy, and how much of it
Each database supplies its own classification, and PaintOmics stores exactly two levels of it, whatever depth the source has:
| Database | Level 1 | Level 2 |
|---|---|---|
| KEGG | The top-level category of KEGG's pathway BRITE hierarchy, br08901 — Metabolism, Genetic Information Processing, Environmental Information Processing, Cellular Processes, Organismal Systems, Human Diseases, Drug Development |
That hierarchy's second level, around fifty entries |
| Reactome | The top-level Reactome event the pathway sits under | The event one level below it |
| MapMan | The primary column of the MapMan classification table | Its secondary column. A bin the table does not list is filed under Not classified / Unclassified |
| OmniPath | One of eight categories assigned from keywords in the pathway's own name — Cancer, Infection and inflammation, Immune signalling, Nervous system, Cell cycle, death and autophagy, Metabolism, Development and tissue remodelling, and Signal transduction for everything else | The annotation resource the pathway came from, such as SIGNOR or NetPath |
Two consequences worth knowing.
Only the classifications your job actually matched appear. The mouse example above shows six KEGG top-level categories, not seven: no Drug Development map was found for it.
OmniPath's level 1 is not a curated hierarchy. It is a keyword rule applied to the pathway name at installation time, so it is a browsing aid rather than a statement about biology, and anything the keywords miss lands in Signal transduction. Level 2, the source resource, is exact. See OmniPath.
Each classification is given a colour by name, and it keeps that colour everywhere on the page: the pie wedge, the letter badge in the tree, the colour stripe in the enrichment table, and the node colouring in the network.
The pie
Category Distribution shows what share of this database's visible pathways falls into each level-1 classification. Each wedge is labelled with its percentage and a coloured letter badge — C, E, G, H, M, O in the mouse KEGG example. Percentages are of the pathways this database found, so the pie always sums to 100% within its own tab.
Click a wedge to drill down into that classification's level-2 entries; the chart's own back link returns to the top level.
The pie is redrawn from what is left every time you press Apply, so it is a picture of the filtered result rather than of the raw one. If you hide everything, it becomes a single red No pathways slice.
The filter tree
Filter by category is the same hierarchy as a tree, three levels deep: level-1 classification, then level-2, then the individual pathways. Click a row's text to expand or collapse it.
The two classification levels each carry three words on the right, revealed when you hover the row:
- Hide ticks nothing below this row.
- Show ticks everything below it.
- Custom is not a control. It is a state indicator: clicking it does nothing, and it lights up on its own when some but not all of the rows below are ticked. Untick one pathway inside a fully shown classification and its parents switch from Show to Custom by themselves.
The third level is a plain tick-box per pathway, with no Hide/Show pair.
Nothing you do in the tree takes effect until you press Apply.
Apply, and what it changes
Apply commits the selection, and it is not a filter on one table. The set of visible pathways is a property of the job, and everything on the results screen reads it:
- the pie is redrawn from the pathways that remain;
- this database's pathway network is rebuilt, so hidden pathways stop being nodes;
- the enrichment table drops their rows — including on a multi-database job, where that one table lists every database;
- the Pathways found and Significant counters recount, overall and per database;
- the FDR-adjusted p-values are recomputed;
- the selection is stored with the job, so it survives a reload and anyone opening the job's link sees the same filtered view.
Each tab filters only its own database. Hiding a KEGG category leaves Reactome's tree exactly as it was — but because the enrichment table is shared, its rows change either way.
Filtering changes the FDR values
A false discovery rate correction depends on how many tests are in the family, and hiding pathways removes tests. PaintOmics therefore asks the server for a fresh set of adjusted p-values over the pathways that remain each time you apply a filter, and swaps them into the table. The raw p-values never move; the FDR columns do. If you are going to quote an FDR value, say what was filtered when you read it.
Where to go next
- Pathway enrichment — the table this filter feeds, and what each of its columns means.
- The pathway network — the other half of the same card, and its own filters on top of this one.
- The KEGG pathways database, Reactome, MapMan and OmniPath — where each hierarchy comes from.