Your first analysis
This page walks through a complete PaintOmics job, screen by screen. Every figure is from the STATegra — real mouse Ikaros time course example: five omics, six time points, mouse, run against KEGG, Reactome and OmniPath. You can follow along exactly by choosing Load example at the top right of the upload form.
A job has four screens:
- Upload — choose the organism, describe your experiment for the AI interpretation, and add one panel per omic layer.
- Mapping — check how many of your features PaintOmics could match, and settle any ambiguous compound names.
- Results — the pathway summary, classification, network, metabolite analyses and the enrichment table.
- The pathway — one diagram, painted with your values.
You do not need an account. A job is reachable from its own URL as soon as it starts. Signing in adds saved jobs, file storage, control over who else can open the job, and a longer retention window — 14 days rather than 7 on this server's configuration. See Accounts, storage and sharing.
1 · Upload
Choose the organism
Type any part of a species name; the picker ranks matches as you type and shows each one's KEGG organism code.

The organism picker, mid-search. The KEGG organism code is shown on the right of each match.
Choosing the organism decides which pathway databases are available, because each database is installed per species. The row ticks the ones this server has for your organism and greys out the rest.

KEGG is always present and cannot be unticked. Reactome and OmniPath are installed for mouse on this server; MapMan is not, so it is shown as not installed.
Every installed database is ticked by default, so untick the ones you do not want rather than hunting for the ones you do. If your species is missing altogether, Request an organism sends the maintainers a request; any organism KEGG carries can be installed.
Decide about the AI interpretation
The second section sets up the AI interpretation. It is the one place your data can leave the server, so it says plainly where it goes.
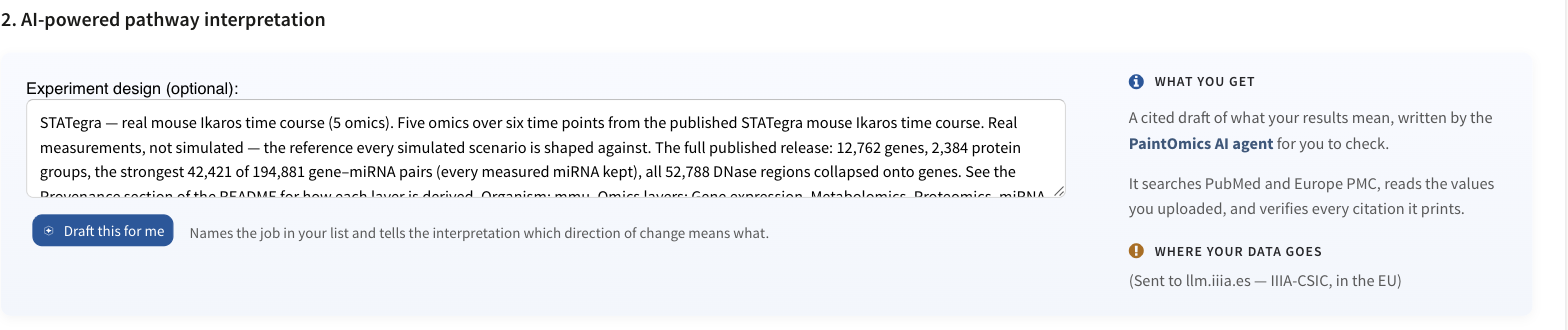
Describing your experiment here is optional, but it is what tells the interpretation which direction of change means what. Draft this for me writes a description from the files you have chosen.
Filling the Experiment design box does two things: it names the job in your job list, and it gives the AI interpretation the context it needs to read a fold change the right way round. Leaving it empty does not disable anything.
Where your data goes
If you use the AI features, the values and pathway results for the job are
sent to whichever gateway this server is configured to use. As shipped that
is llm.iiia.es, operated by IIIA-CSIC (the Artificial Intelligence
Research Institute of the Spanish National Research Council) and running in
the EU; the form names the current one under Where your data goes, and
the (!) beside it opens the full notice. Nothing goes out until you ask for
something: Draft this for me sends the column names of the files you
have picked, and the interpretation sends the job's results and values.
Add your files
PaintOmics starts with two omic panels, Gene expression and Metabolomics. Add more from the Available omics column on the left, and remove any you do not need with the bin icon.
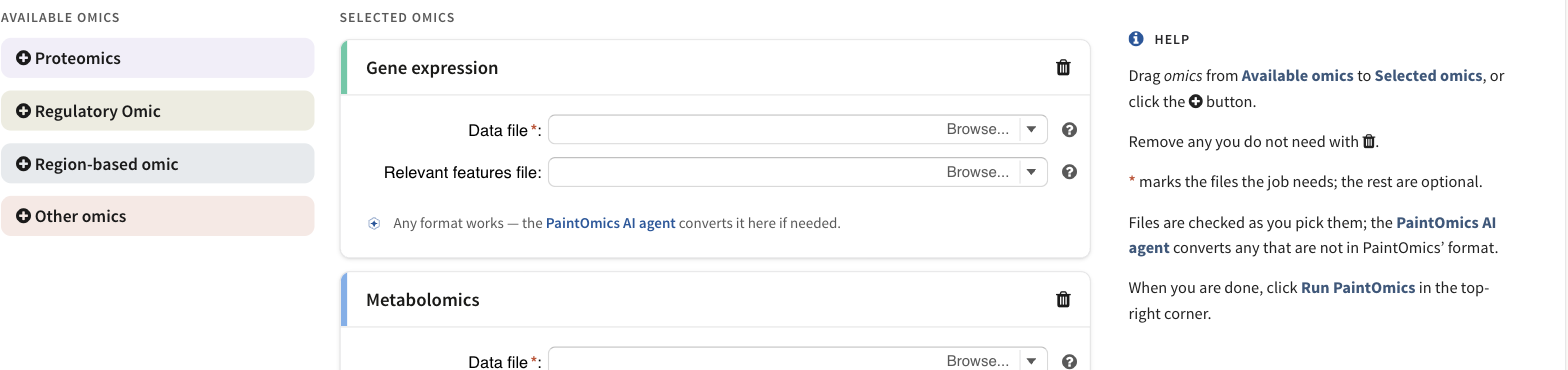
The empty upload form. Drag an omic from Available omics into Selected omics, or click its +. Proteomics is a shortcut with a fixed name and disappears once used; the generic entries can be added more than once, as long as each panel gets a different name.
Each panel takes a Data file — one row per feature, one column per condition — and, optionally, a Relevant features file listing the features you consider significant. What those files must contain for each kind of omic is set out in Preparing your data.
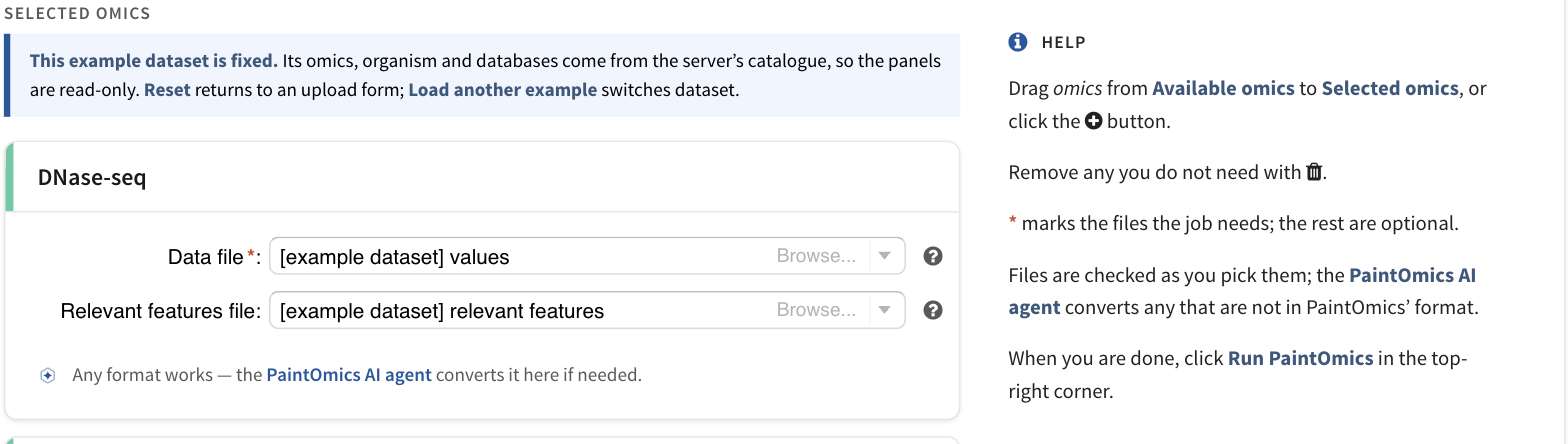
One omic panel. A red asterisk marks the file the job actually needs; the rest are optional.
Browse… lives inside the file field and offers three things:
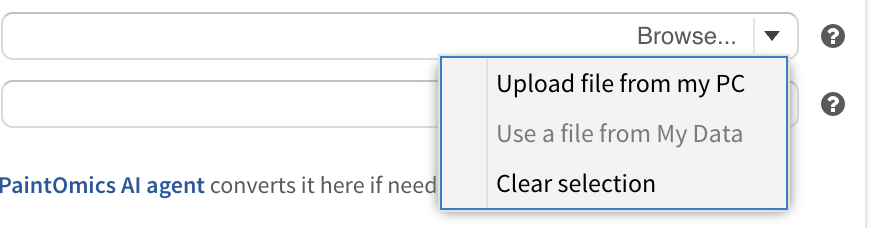
Uploading from your computer always works. Use a file from My Data needs an account; Clear selection empties the field.
You do not have to convert your files first, on a server that has the converter turned on — it is off by default and the operator opts in. Where it is on, PaintOmics checks each file as you pick it and offers anything that is not already in its format to the AI input converter, which converts it in your browser and shows you what it did before you accept it.

The software the converter reads, and the file types the form accepts. Download example data gives you the whole example catalogue to inspect.
When the form is complete, click Run PaintOmics in the top-right corner. The job gets an ID and a URL immediately — you can close the tab and come back to it.
2 · Mapping
PaintOmics converts the identifiers in your files into the ones each pathway database is keyed on, and this screen is where you check that it went well. The left-hand Analyses rail lists the sections; there is nothing to do here except read them and, if you have metabolomics, settle any ambiguous names.
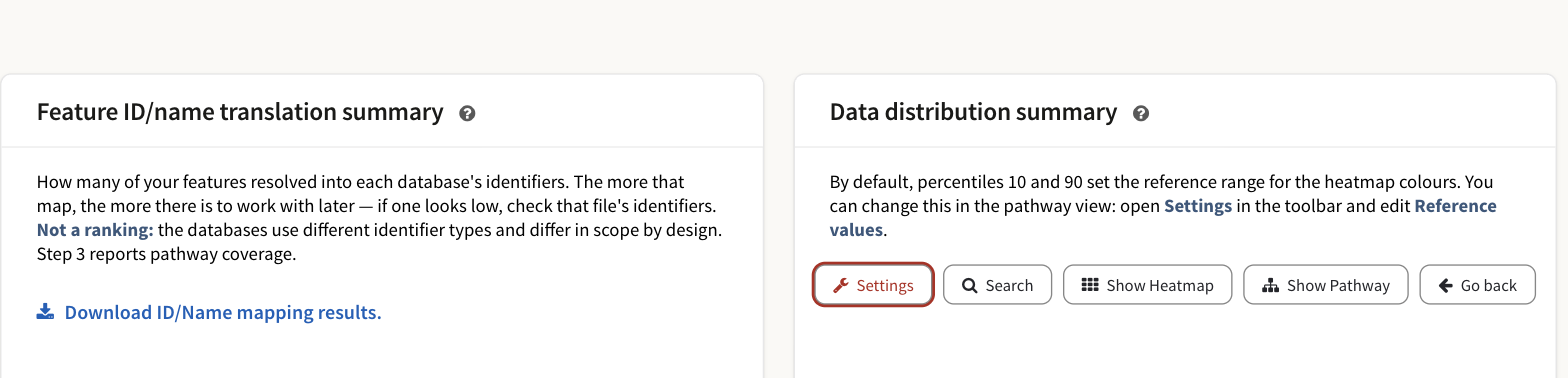
The two summary cards at the top of the mapping screen.
How much of your data matched
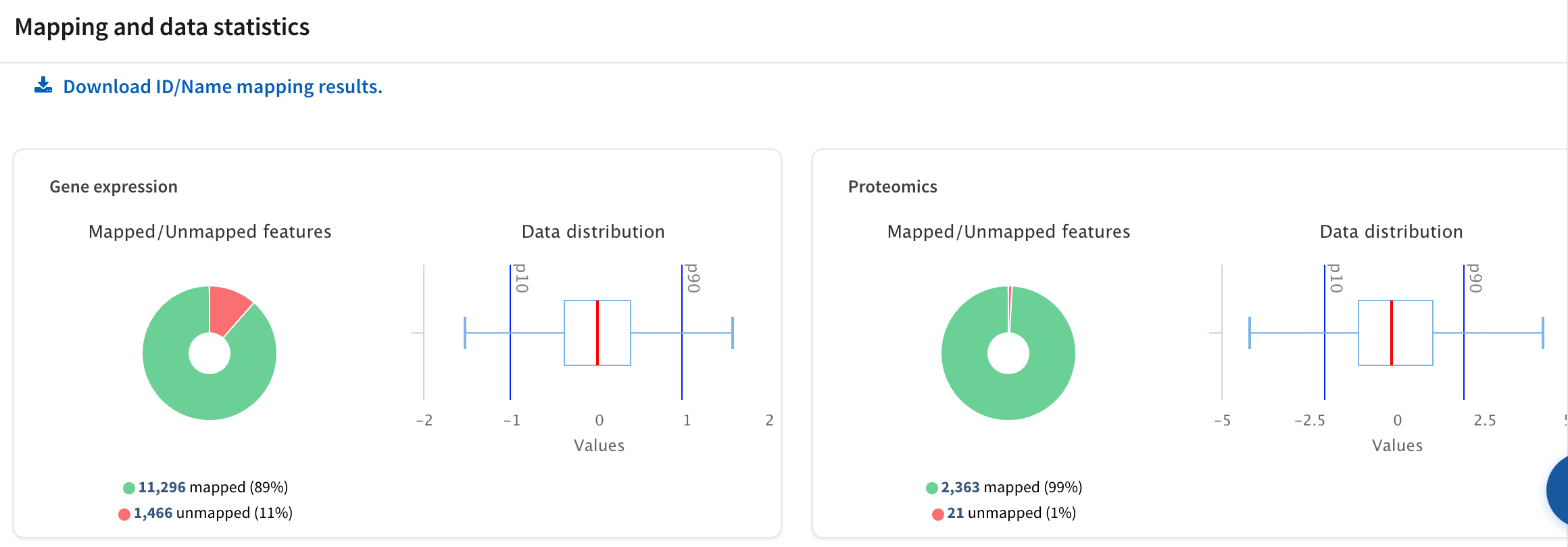
One card per omic: how many features were matched, and the distribution of the values that will be used for colouring. The blue lines mark the 10th and 90th percentiles, which become the default ends of the colour scale.
A low match rate is worth investigating before you go on: it usually means the identifiers in that file are from a namespace PaintOmics could not resolve for your species. See Supported identifiers.
One omic against several databases
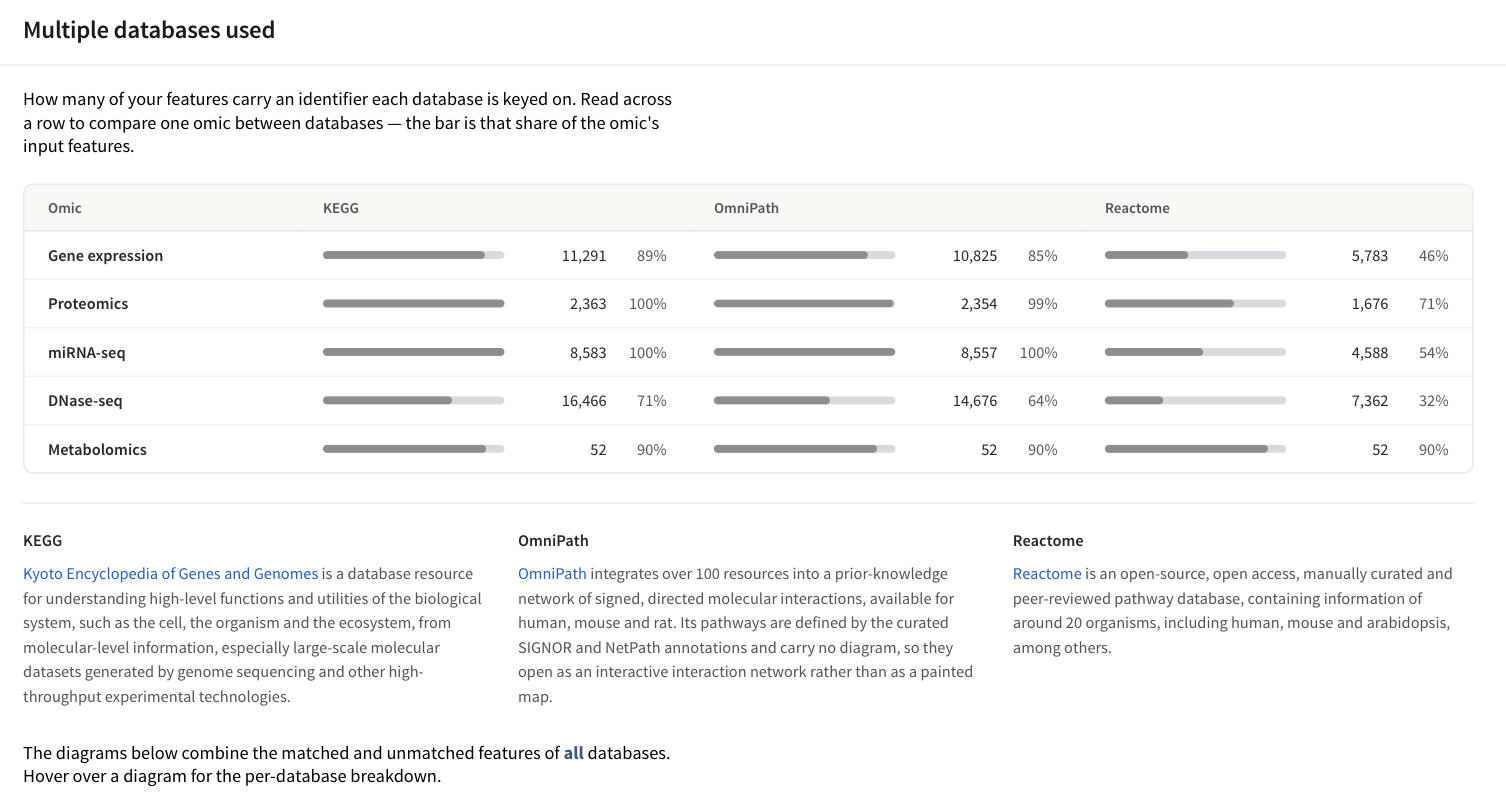
Read across a row to compare one omic between databases. The bar is the share of that omic's input features carrying an identifier the database is keyed on.
This table is not a ranking. The databases use different identifier types and differ in scope by design — Reactome covers fewer mouse genes than KEGG because it is a different kind of resource, not a worse one. What matters for your result is pathway coverage, which Step 3 reports.
If your columns look like replicates
If the column headers of a values file look like replicates of the same sample — the same name with a trailing suffix — Step 2 adds a Replicate detection card for that omic and asks what you want done with them. The detector is deliberately conservative: it only offers the card when the pattern is unambiguous, so not seeing it is not a claim that your file has no replicates.
| Choice | What happens |
|---|---|
| Show all replicates | Nothing is aggregated. Every column stays its own condition, which is what PaintOmics did before this existed. |
| Average replicates | Use the grouping the server detected: each sample's replicates are averaged into one value per feature. |
| Upload design file | Supply the grouping yourself, as a two-column tab-separated file mapping each column to a sample label. Use this whenever the detector's guess is not exactly your design. |
Confirming rewrites the per-sample values for that omic, and the pathway view can then show samples rather than raw columns. It also gives the metabolite class activity test the replicates it needs to run its permutation test instead of the binomial one — which is the main reason to bother.
The clustering setting
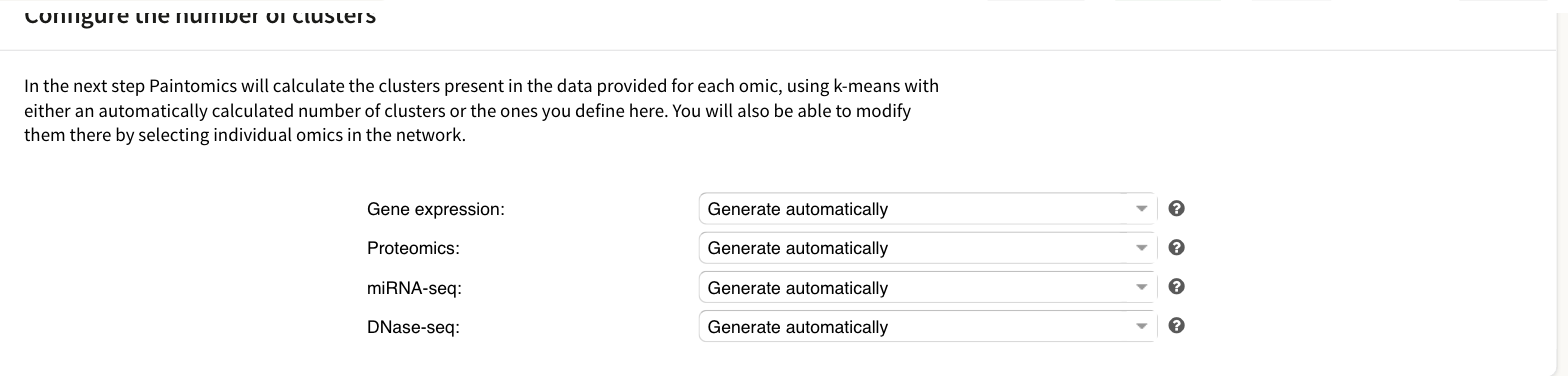
One setting per gene-based omic. Left alone, PaintOmics picks the number of k-means clusters itself; you can also fix it here, or change it later from the pathway network.
Metabolite class activity
If you uploaded a compound-based omic, PaintOmics will also test whether whole KEGG BRITE classes responded. This panel tells you which of the two tests your data supports and why.
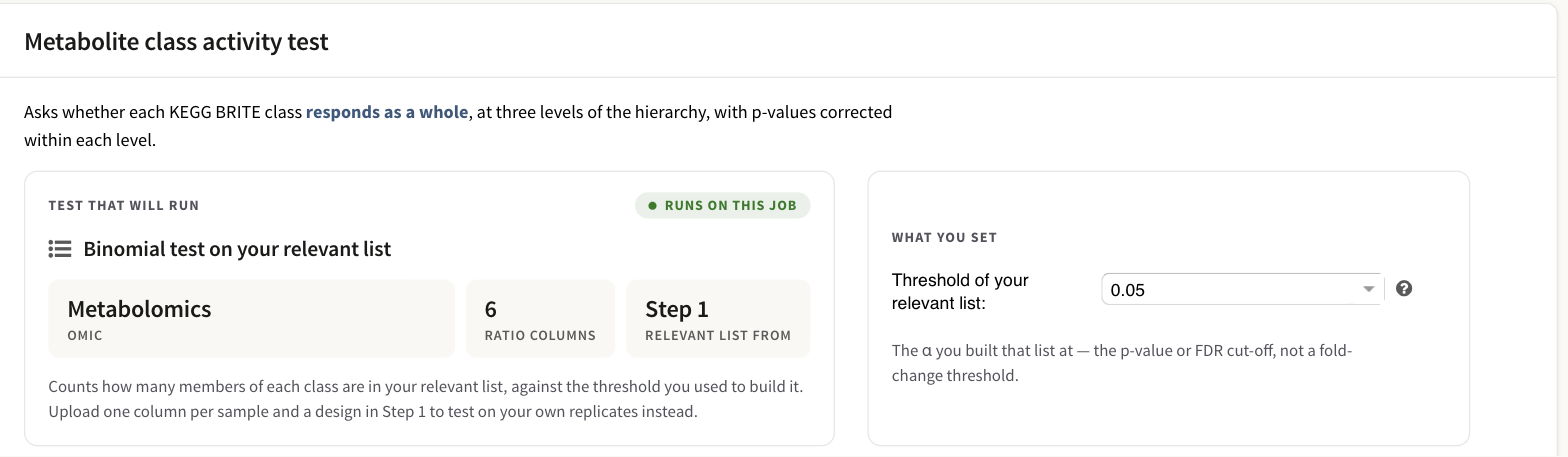
What will run on this job, and the one thing you set: the threshold your relevant-features list was built at.
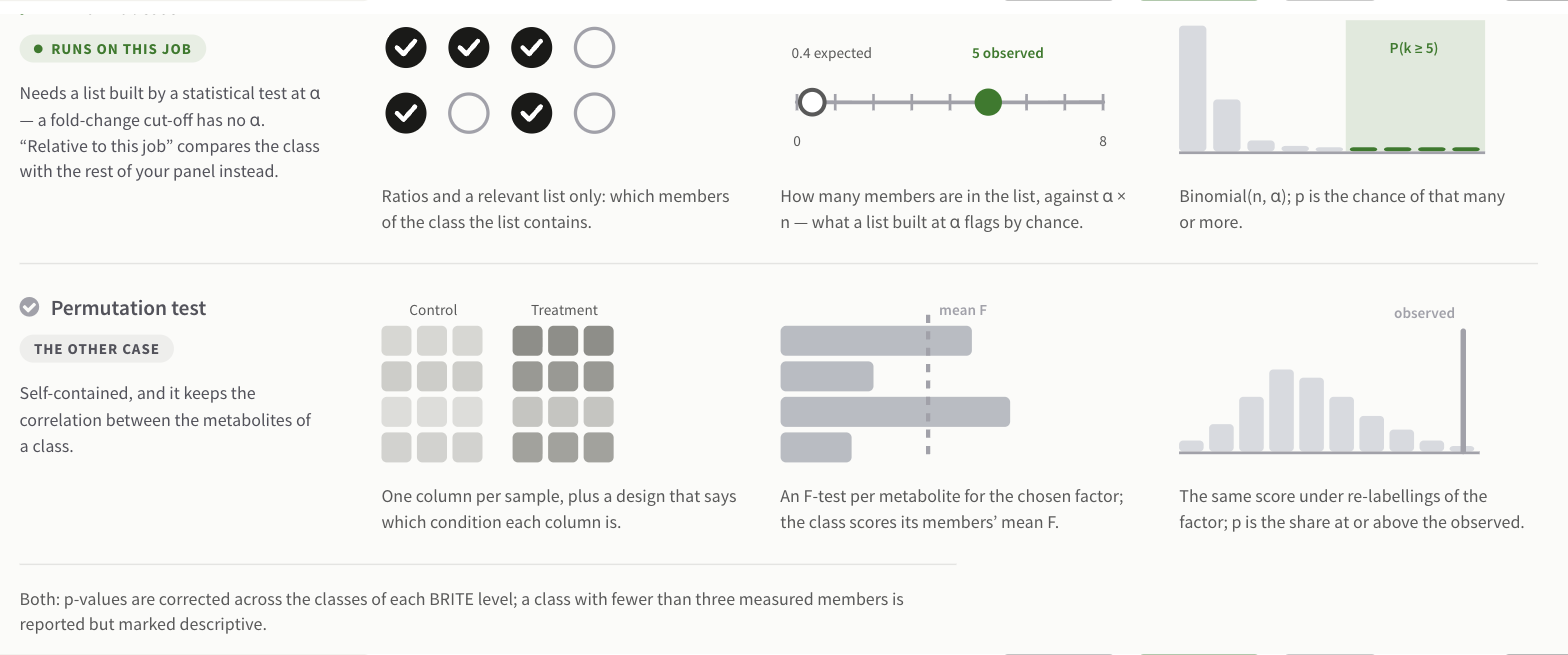
The binomial test needs a relevant list built at a known α. The permutation test needs one column per sample and an experimental design — upload those in Step 1 and PaintOmics uses it instead.
Compound disambiguation
A metabolite name often matches more than one KEGG compound. PaintOmics ticks its best guess and shows you every candidate.
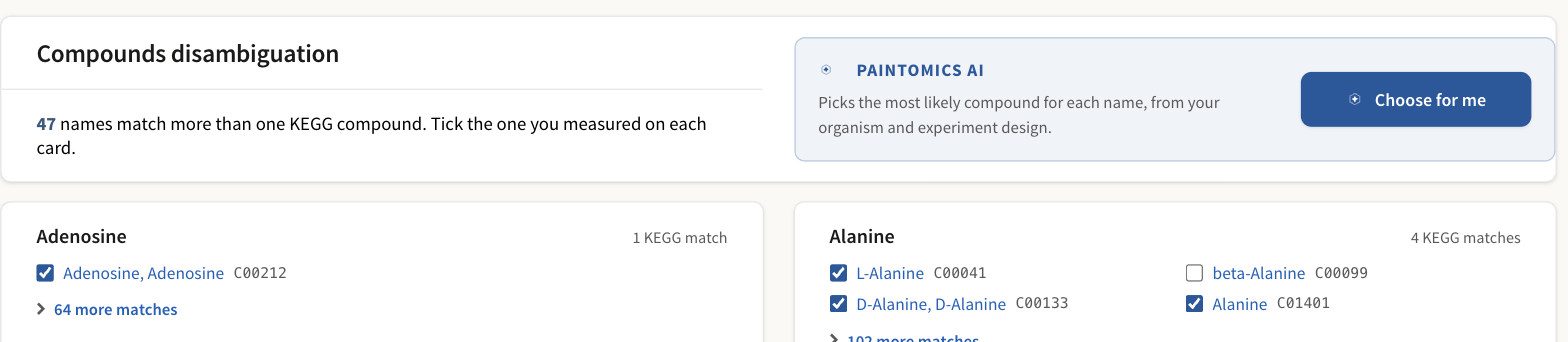
Each card is one name from your file. Tick the compound you actually measured; Choose for me asks the AI to pick for all of them at once, using your organism and experiment description.
Getting this wrong changes which pathways a metabolite lands in, so it is worth a minute — particularly for names like Alanine, where the generic entry and the L- and D- forms are separate KEGG compounds. The exact-name match is not automatically the right one.
Click Next step when you are satisfied.
3 · Results
The summary
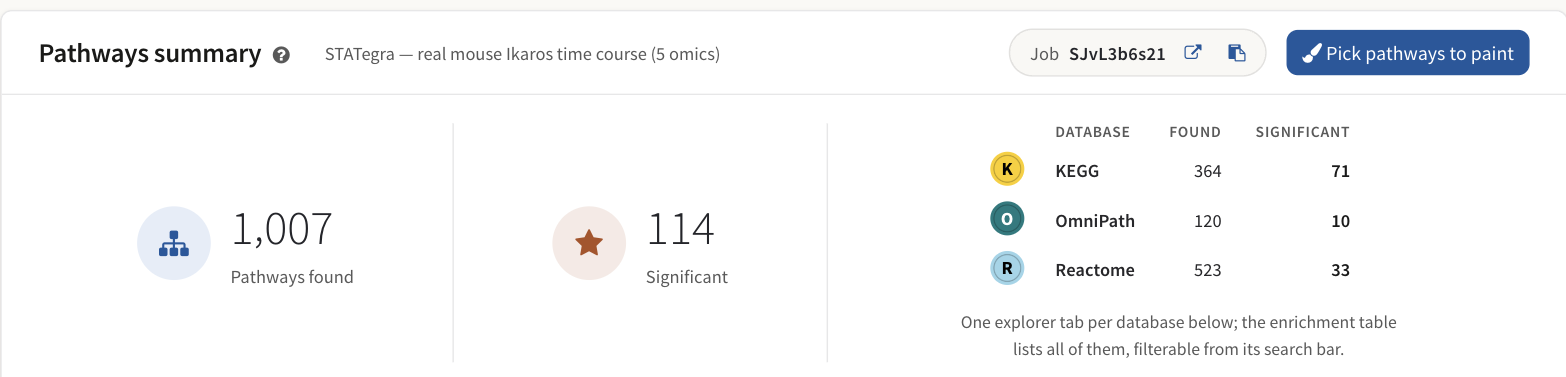
How many pathways were found in total and how many are significant, broken down by database.
"Found" means the pathway contains at least one of your matched features. "Significant" means its p-value is 0.05 or less. The threshold is fixed and the FDR setting does not enter it. Which p-value is read depends on how many databases the job used, not how many omics: with more than one it is the combined value under the method chosen in Show combined p-values; with one it is the first omic's own p-value, and the combination method does not move the count. Both counters follow the classification filter, so hiding a category moves them. See Pathway enrichment.
Classification
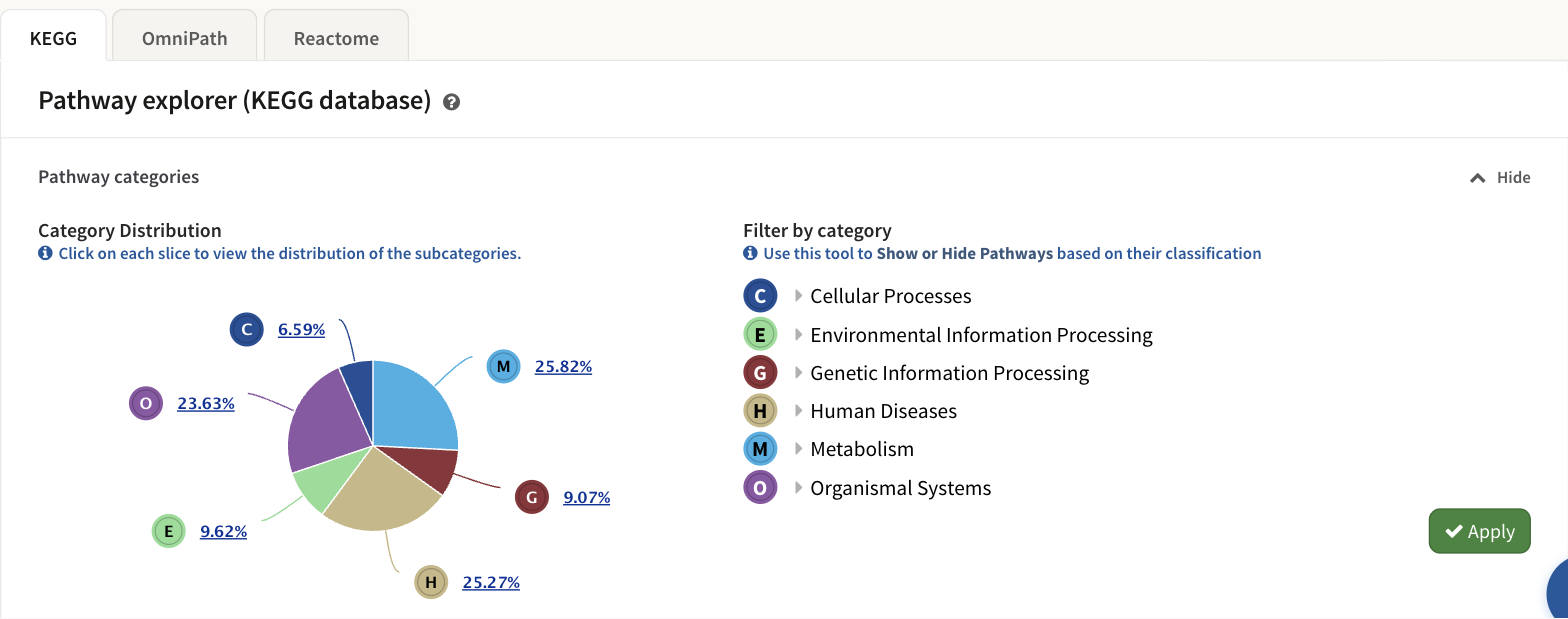
One tab per database. The pie shows how the found pathways are distributed across the top-level classification; the tree beside it filters the whole results screen.
The hierarchy is the database's own: KEGG BRITE for KEGG, and the equivalent for Reactome, MapMan and OmniPath. See Pathway classification.
The pathway network
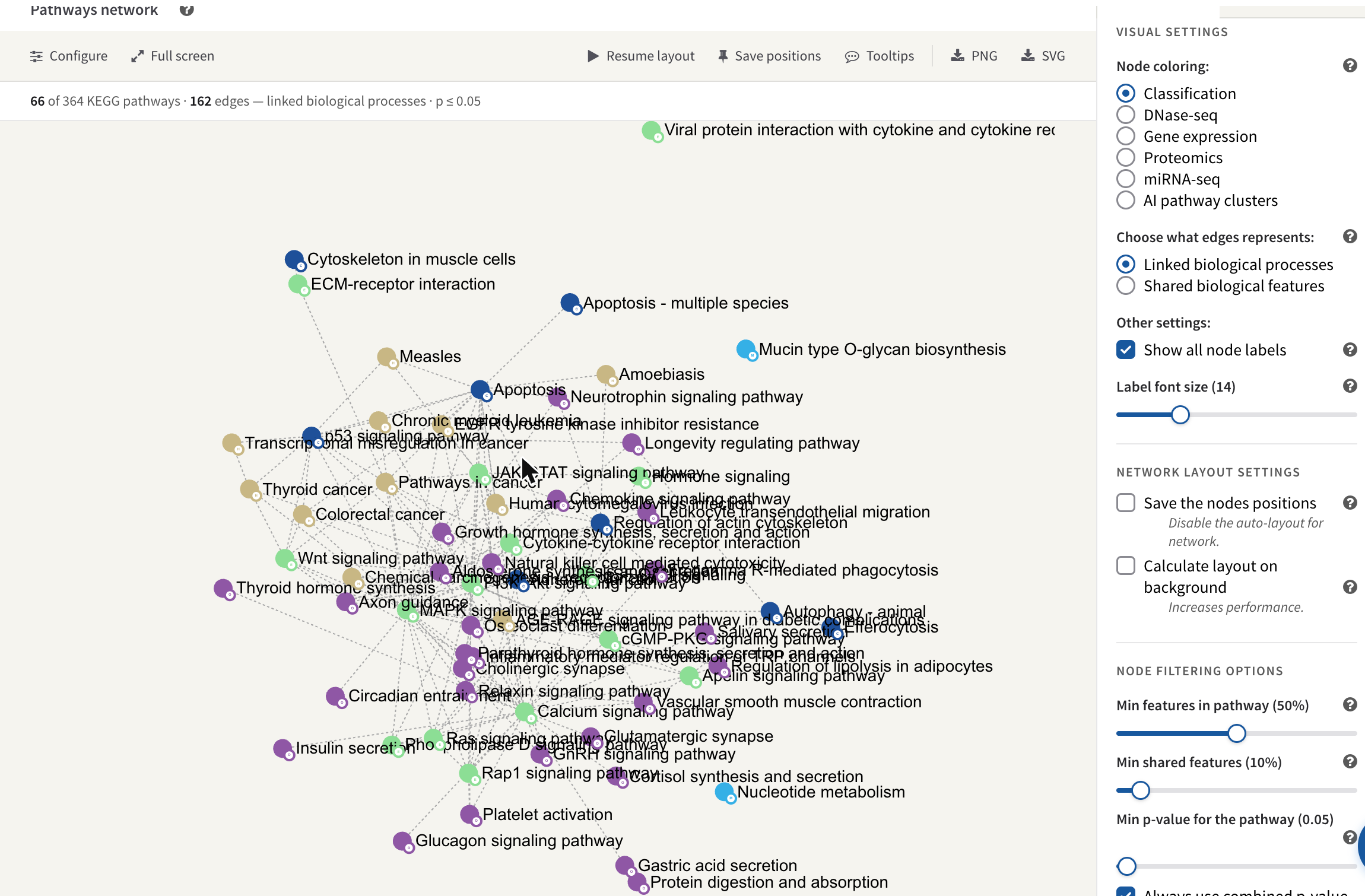
Pathways as nodes, joined where they share biological processes or features. Everything on the right changes what is drawn.
This is the fastest way to see that a result is one story rather than forty separate ones. The pathway network explains the colouring, the two kinds of edge and the filters.
The metabolite analyses
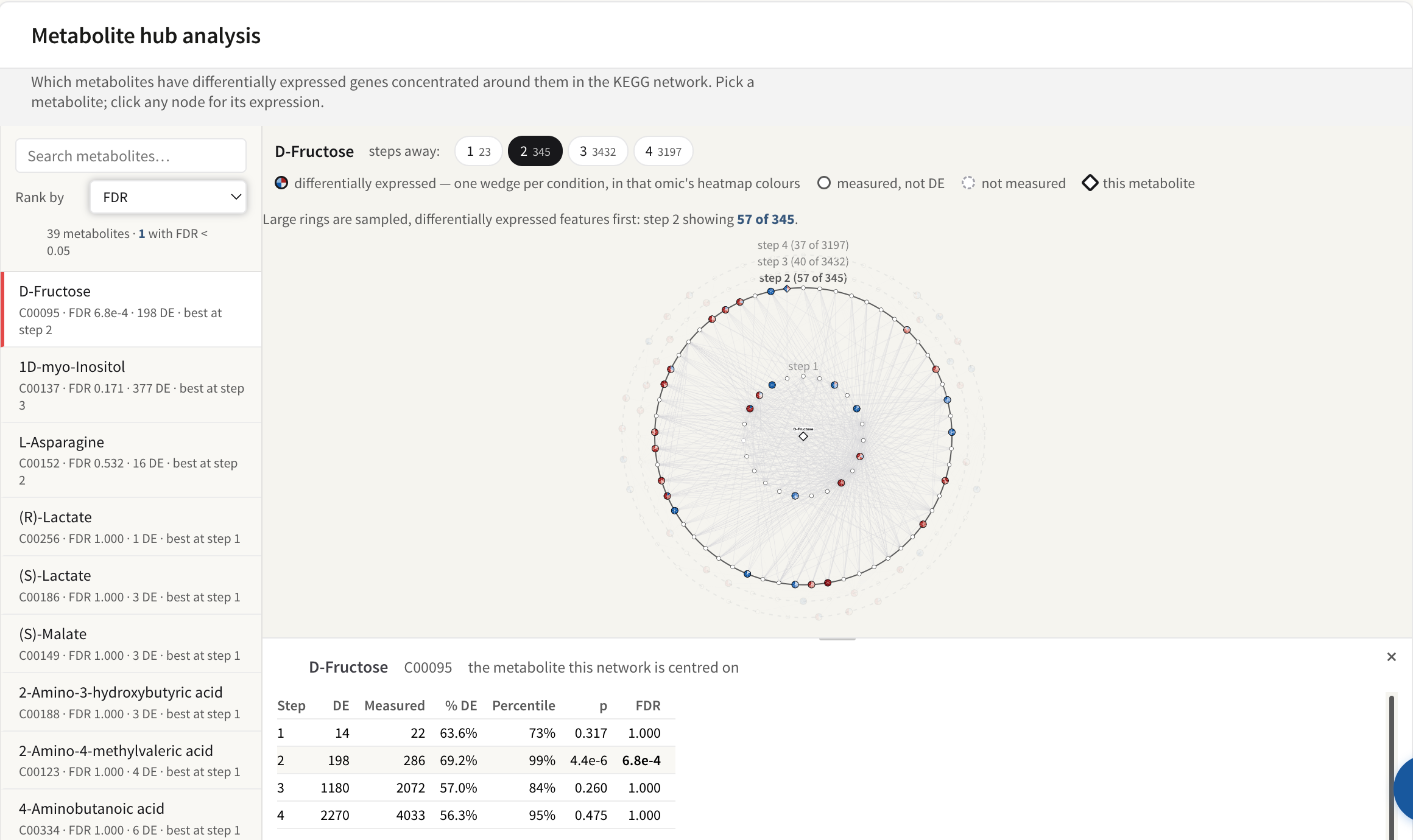
Which metabolites have differentially expressed genes concentrated around them in the KEGG reaction network. See Metabolite hub analysis.
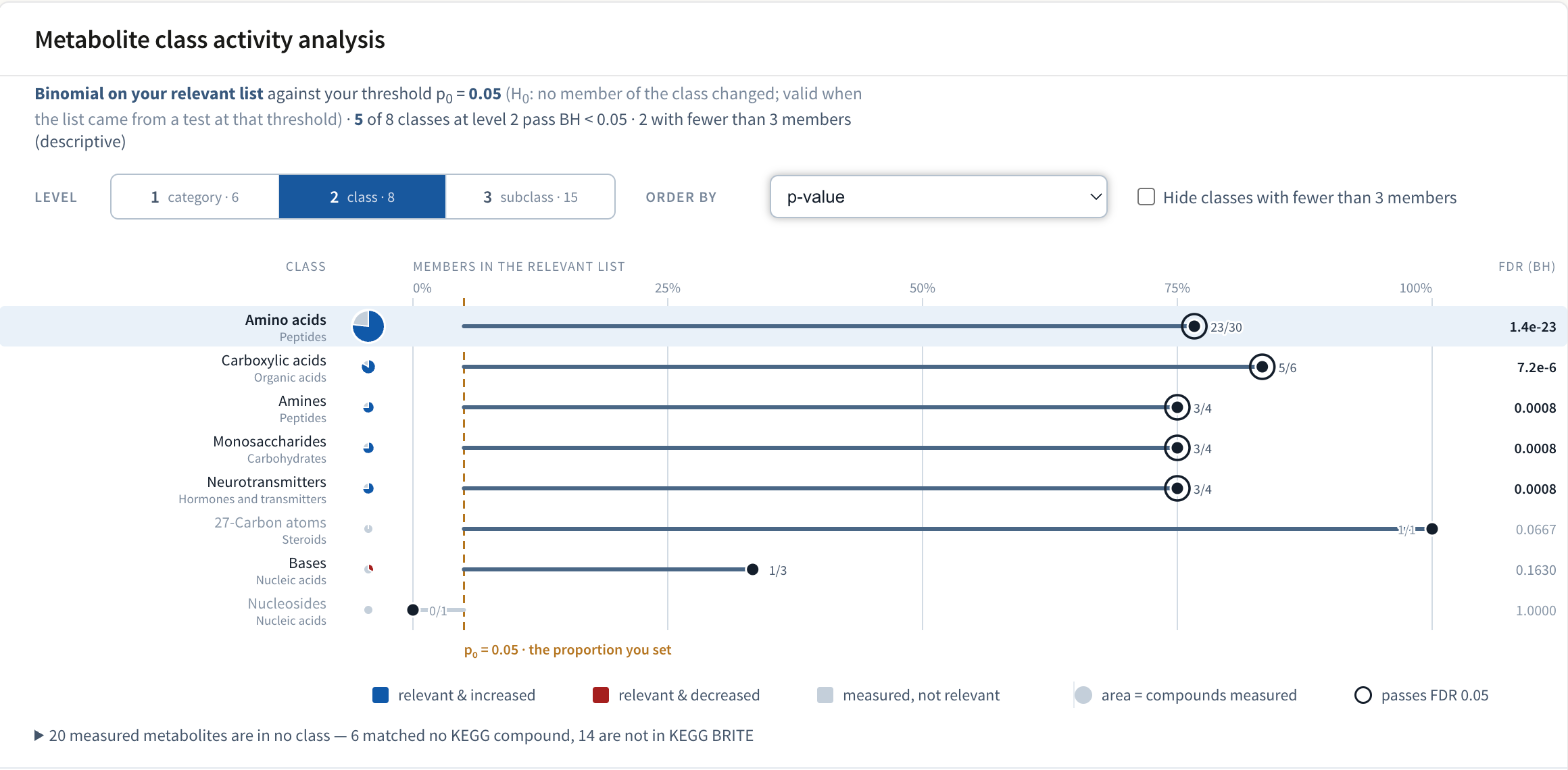
Whether whole compound classes moved, at three levels of the KEGG BRITE hierarchy. See Metabolite class activity.
The enrichment table
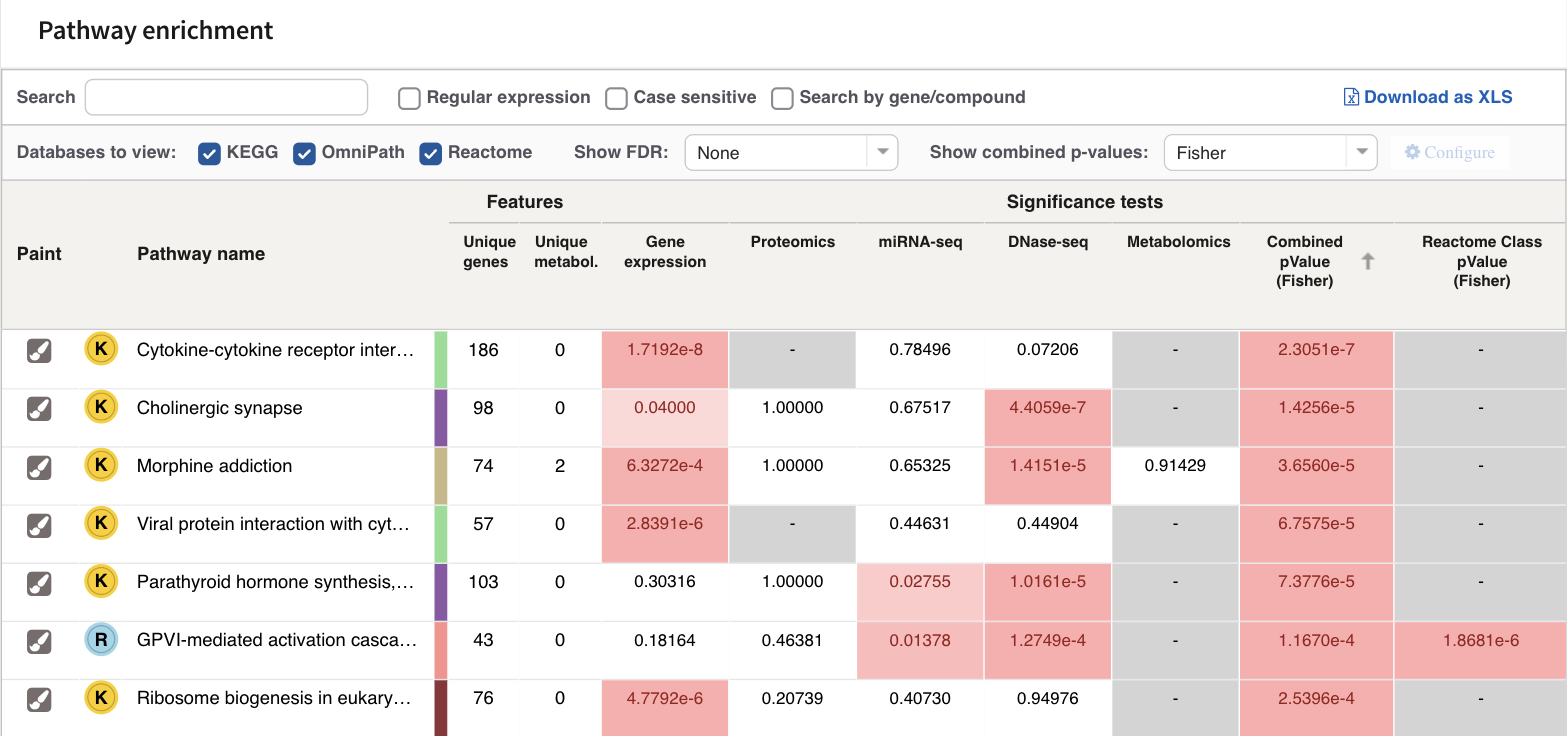
Every pathway from every database, with one p-value column per omic and a combined p-value. Sort by any column; the paint icon opens the pathway.
The controls above the table decide what it shows and how significance is computed — which databases to list, whether to show FDR-adjusted values, and which method combines the per-omic p-values. Pathway enrichment explains each of them, and Download as XLS exports exactly what you are looking at.
4 · The pathway
Clicking the paint icon on any row opens that pathway with your data on it.
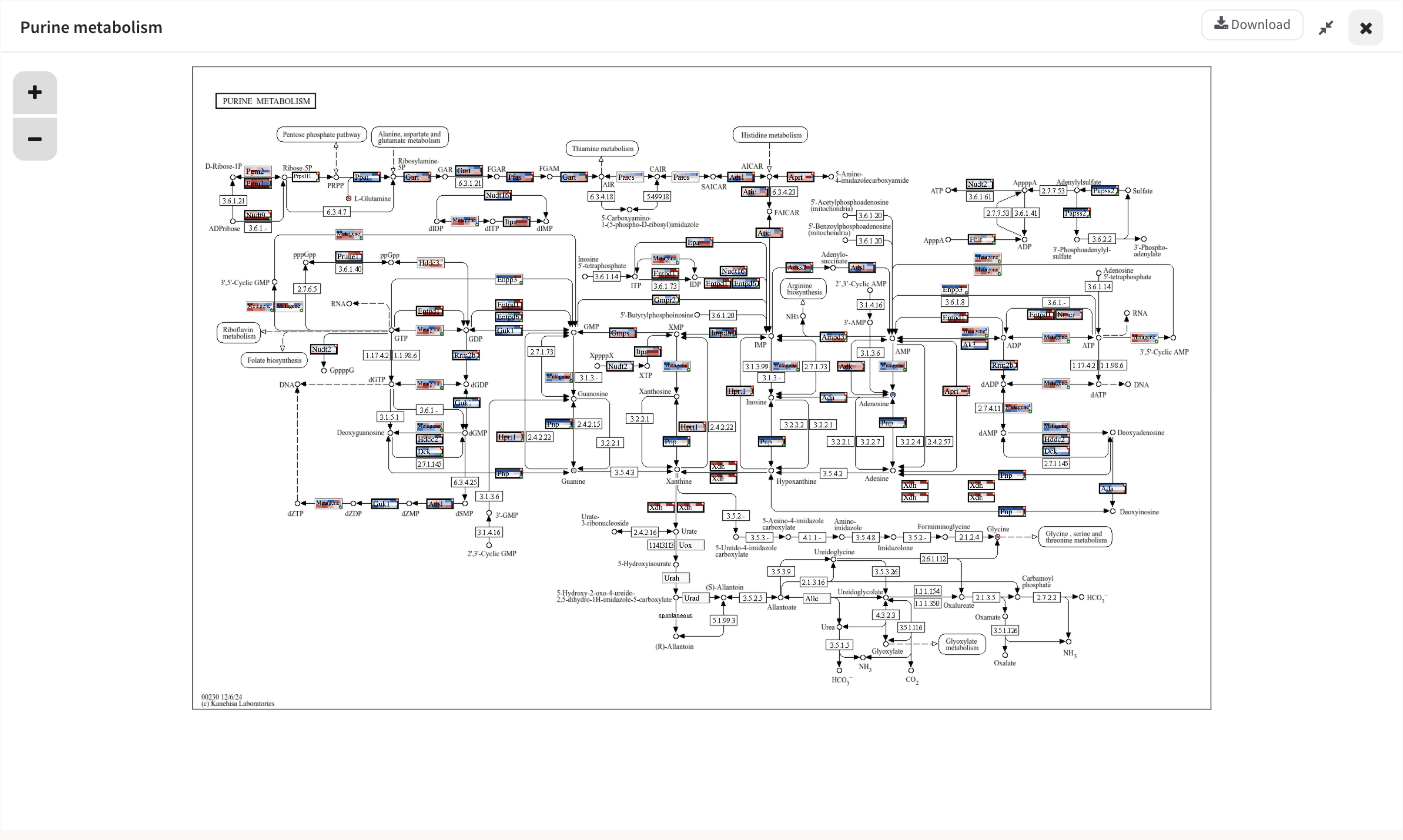
Purine metabolism, painted with five omics over six time points.
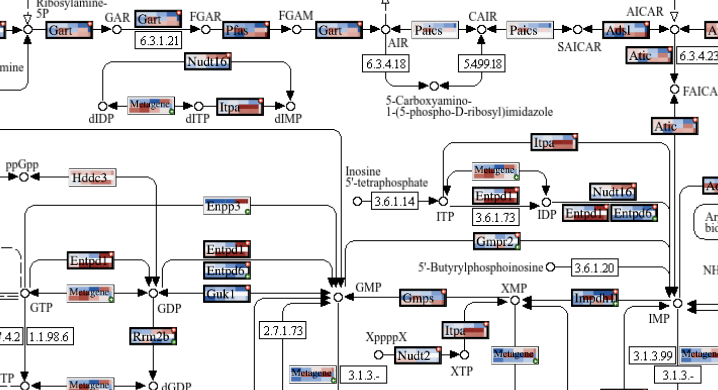
Each matched feature is one box, split into one cell per condition, left to right in the order of your columns. On the default Blue-Grey-Red scale, blue is below the reference and red above.
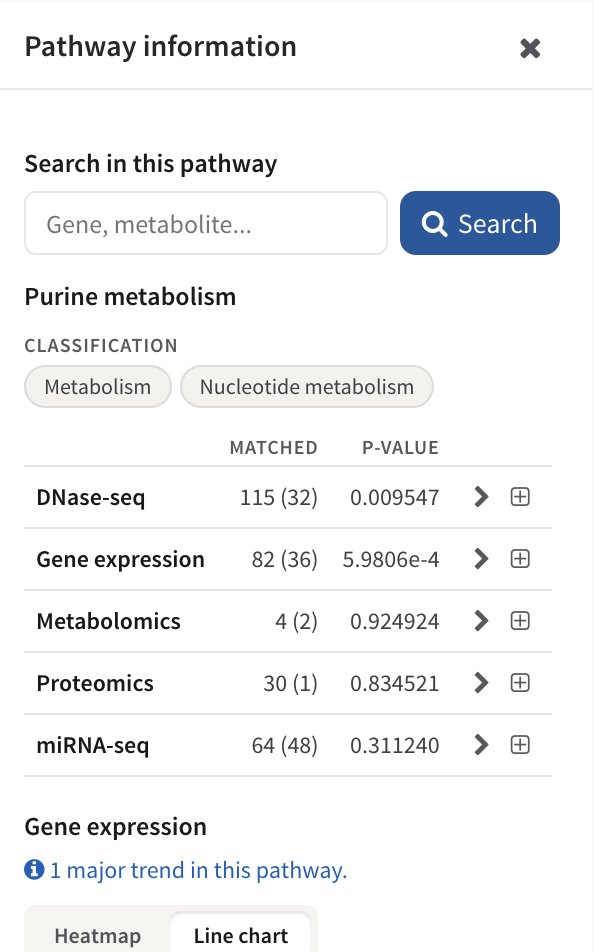
How many features of each omic this pathway matched, how many of those were in your relevant list (in brackets), and the p-value for each.
Clicking any painted box opens the feature itself — every omic that measured it, as a heatmap or a line chart.
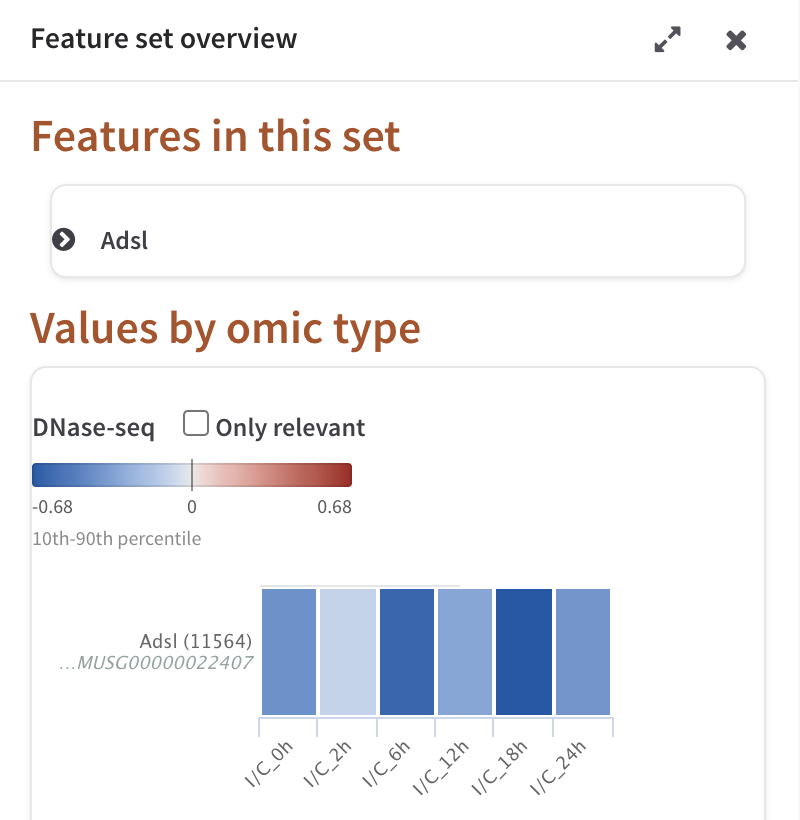
One feature across all five omics. A box on a KEGG map can stand for several genes, so the panel lists everything in the set.
The pathway view covers the toolbar, the visual settings and the export options; Feature details and Heatmaps cover the two panels that open beside the map.
What next
- See the same analysis read end to end, with its real numbers and what they do and do not support: A worked example.
- Let the AI agent walk the whole result and draft an interpretation: The interpretation.
- Model regulation explicitly, rather than layer by layer: Regulatory omics with MORE.
- Share the job, or keep it: Accounts, storage and sharing.